Does Diabetes Correlate With Affluence?
Contents
Does Diabetes Correlate With Affluence?#
Bill Alive
Last updated: 2022 Sep 15
Motivation#
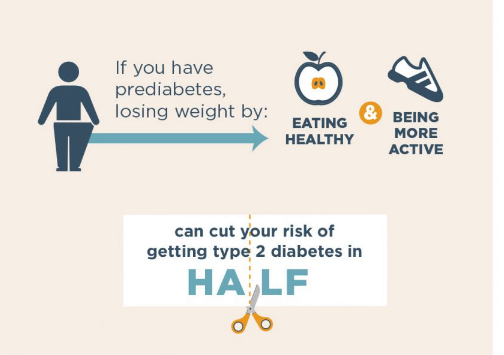
According to the CDC, the overwhelming majority of diabetes cases (Type 2) can be “prevented or delayed with healthy lifestyle changes”.
Yet in the United States:
Diabetes is the 7th leading cause of death.
About 1 in 10 people have diabetes (37 million), and more than 1 in 3 adults (96 million) have prediabetes.
And these numbers are growing. Diabetes diagnoses for adults have more than doubled in the last two decades.1
Is this an inevitable risk of affluence? Or can other wealthy countries give hints of how we might reduce this threat?
On the other hand, what if poorer countries have high rates too?
Research Question#
Do higher income countries tend to have higher rates of diabetes?#
If they do, the problem seems obvious: more wealth means easier access to food and less need for physical activity, both of which increase this risk.
But what if some poorer countries have rates as high (or higher!) than the US? And what if some other wealthy countries have much lower rates?
Note
This notebook is adapted from a project for my MicroMasters in Data Science from UC San Diego.
The original assignment imposed a strict template and fairly simple options for analysis.
But the results still surprised me.
Our Dataset#
World Bank: World Development Indicators#
The World Development Indicators dataset is the “World Bank’s premier compilation of cross-country comparable data on development.”
The full dataset includes data from 1960 to 2021. Each row consists of a country (or country grouping, like “High income”), an indicator, and then, for each year, a separate column holding that indicator’s value for that country in that year.
For this project, let’s focus on a single year of data.
See also
You can view the
original PDF report for this project.
For the original project, the most recent data available was for 2014. Although the conclusions were the same, the data for individual countries were significantly different. Here, we will use a more recent year.
Setup#
import pandas as pd
import numpy as np
import random
import matplotlib.pyplot as plt
from adjustText import adjust_text
Helper Functions#
Let’s define a few helper functions for this project.
## TABLES

def row_style(row):
    ## The index is the country name.
    if row.name in 'United States':
        return ['background-color: yellow'] * len(row)


def missing_data_style(v):
    return 'background-color: red; color: white; font-weight: bold;' if v == 0 else None


def country_style(s):
    # https://pandas.pydata.org/pandas-docs/stable/reference/api/pandas.io.formats.style.Styler.apply_index.html#pandas.io.formats.style.Styler.apply_index
    return np.where(s == "United States", "background-color: yellow;", "")


def country_color(idx, countries, color):
    return f"color: {color};" if idx in countries else None


def ind(df, indicators, sort_index=0, countries=None):
    """Given indicator(s), show the top results.

    Parameters:
      df: dateset (one year of data, pivoted)
      indicators: list of one or more indicators
      sort_index: index of column in indicators to sort by.
      countries: show only rows with these countries as index.
    """
    df = df[indicators]

    if countries:
        df = df.loc[countries]

    df = df.sort_values(indicators[sort_index], ascending=False)
    return df


def show_df(df, head=None, caption=""):
    """Format df for display."""
    global year
    ## https://pandas.pydata.org/pandas-docs/stable/user_guide/style.html#Finer-Control:-Display-Values
    if head:
        df = df.head(head)
    return df.style.format(precision=2, na_rep='MISSING', thousands=",")\
        .set_table_styles(table_styles)\
        .apply_index(country_style)\
        .applymap(missing_data_style)\
        .set_caption(f"{caption} ({year})")


def s(df, indicators, countries='countries', head=10, sort_index=0, caption=""):
    """Show indicator(s) for pivoted table (one year's data),
    filtered to particular countries or groups.

    Parameters:
      df: dateset (one year of data, pivoted)
      indicators: list of one or more indicators
      sort_index: index of column in indicators to sort by
      countries: show only rows with these countries as index
      head: show only this number of rows
    """
    countryName=data['Country Name'].unique().tolist()
    first_country='Afghanistan'

    ## For countries, pass either a keyword or an actual list of countries.
    ## Default is to show only country names.
    if countries=='countries':
        countries = countryName[countryName.index(first_country):]
    elif countries=='groups':
        countries = countryName[0:countryName.index(first_country)]
    else:
        assert(isinstance(countries, list))

    df_ind = ind(df, indicators,countries=countries, sort_index=sort_index)
    return show_df(df_ind,head=head,caption=caption)


## CHARTS

def add_country(df, plt, country, label=None,box=None,c=None):
    if label is None:
        label = country

    df = df.loc[country]
    X = df[ind_gni_per_capita]
    Y = df[ind_diabetes]

    if box:
        bbox=dict(facecolor=box, alpha=1)
    else:
        bbox=None

    # Draw this country's point.
    if c is not None:
        plt.scatter(X,Y,s=30,c=c)

    # Only use this function for individual points.
    plt.text(X+2, Y+2, label, bbox=bbox)
    return


def collect_texts(df_list, colors, xf, yf):
    texts = []
    for df, color in zip(df_list, colors):
        countries = list(df.index)
        for x, y, country in zip(df[xf], df[yf], countries):
            texts.append(plt.text(x,y,country,color=color))
    return texts


def plot_countries(axis,plt,df,color,dot_size):
    X = df[ind_gni_per_capita]
    Y = df[ind_diabetes]
    axis.scatter(X,Y,s=dot_size,c=color)
    return


def config_axis(axis,plt,df,xlim,ylim):
    axis.yaxis.grid(True)
    axis.set_xlabel("Per Capita Income",fontsize=10)
    axis.set_ylabel("Diabetes prevalence",fontsize=10)
    X = df[ind_gni_per_capita]
    Y = df[ind_diabetes]
    axis.set_adjustable('box')
    axis.set_xbound(lower=-500, upper=xlim)
    axis.set_ybound(lower=-0.2, upper=ylim)
    # TODO Get set_xlim and set_ylim to work properly.
    # Currently, they add much more than specified to the axes, which
    # makes the origin (0,0) too far from the bottom left corner.
    # axis.set_xlim(left=-500, right=xlim)
    # axis.set_ylim(bottom=-0.2, top=ylim)
    axis.tick_params(axis='x',labelrotation=45)
    axis.set_xticks(axis.get_xticks().tolist())
    axis.set_yticks(axis.get_yticks().tolist())
    plt.gca().set_xticklabels(['${:,.0f}'.format(x) for x in plt.gca().get_xticks()])
    plt.gca().set_yticklabels(['{:,.0f}%'.format(y) for y in plt.gca().get_yticks()])
    return X, Y


## VARIABLES

# Colors
color_wealth = 'lightgreen'
color_diabetes = 'pink'

# Formats
fmt_usd = "${:20,.0f}"
fmt_percent = "{:20,.1f}%"

# Styles
table_styles = [
    dict(selector="caption", \
         props=[("caption-side", "bottom"),\
                ("text-align","left"),\
                ("padding-top","1em"),\
                ("color","gray")
               ])
]
Data Preparation and Cleaning#
Let’s import the data and look at the first few rows.
See also
For the helper functions I wrote to prepare the WDI dataset, see my WDI helper functions.
%run ../lib/WDI.ipynb
data = get_wdi()
data.head(5)
| Country Name | Country Code | Indicator Name | Indicator Code | 1960 | 1961 | 1962 | 1963 | 1964 | 1965 | ... | 2013 | 2014 | 2015 | 2016 | 2017 | 2018 | 2019 | 2020 | 2021 | Unnamed: 66 | |
|---|---|---|---|---|---|---|---|---|---|---|---|---|---|---|---|---|---|---|---|---|---|
| 0 | Africa Eastern and Southern | AFE | Access to clean fuels and technologies for coo... | EG.CFT.ACCS.ZS | NaN | NaN | NaN | NaN | NaN | NaN | ... | 16.936004 | 17.337896 | 17.687093 | 18.140971 | 18.491344 | 18.825520 | 19.272212 | 19.628009 | NaN | NaN |
| 1 | Africa Eastern and Southern | AFE | Access to clean fuels and technologies for coo... | EG.CFT.ACCS.RU.ZS | NaN | NaN | NaN | NaN | NaN | NaN | ... | 6.499471 | 6.680066 | 6.859110 | 7.016238 | 7.180364 | 7.322294 | 7.517191 | 7.651598 | NaN | NaN |
| 2 | Africa Eastern and Southern | AFE | Access to clean fuels and technologies for coo... | EG.CFT.ACCS.UR.ZS | NaN | NaN | NaN | NaN | NaN | NaN | ... | 37.855399 | 38.046781 | 38.326255 | 38.468426 | 38.670044 | 38.722783 | 38.927016 | 39.042839 | NaN | NaN |
| 3 | Africa Eastern and Southern | AFE | Access to electricity (% of population) | EG.ELC.ACCS.ZS | NaN | NaN | NaN | NaN | NaN | NaN | ... | 31.794160 | 32.001027 | 33.871910 | 38.880173 | 40.261358 | 43.061877 | 44.270860 | 45.803485 | NaN | NaN |
| 4 | Africa Eastern and Southern | AFE | Access to electricity, rural (% of rural popul... | EG.ELC.ACCS.RU.ZS | NaN | NaN | NaN | NaN | NaN | NaN | ... | 18.663502 | 17.633986 | 16.464681 | 24.531436 | 25.345111 | 27.449908 | 29.641760 | 30.404935 | NaN | NaN |
5 rows × 67 columns
Choose Our Indicator#
Let’s find the most relevant indicator that includes the word “diabetes”:
list(data[data['Indicator Name'].str.contains('diabetes',case=False)]['Indicator Name'].unique())
['Diabetes prevalence (% of population ages 20 to 79)',
 'Mortality from CVD, cancer, diabetes or CRD between exact ages 30 and 70 (%)',
 'Mortality from CVD, cancer, diabetes or CRD between exact ages 30 and 70, female (%)',
 'Mortality from CVD, cancer, diabetes or CRD between exact ages 30 and 70, male (%)']
All right. Clearly, our best indicator is: 'Diabetes prevalence (% of population ages 20 to 79)'
ind_diabetes='Diabetes prevalence (% of population ages 20 to 79)'
Which Year Should We Use?#
Strangely, many years in this dataset have no data for diabates prevalence. Let’s choose the most recent year for which we have sufficient data.
We’ll sort each year by the number of empty entries for this indicator.
data[data['Indicator Name'].str.contains(str(ind_diabetes),regex=False,case=False)].isna().sum(axis=0).sort_values(ascending=True).head(10)
Country Name        0
Country Code        0
Indicator Name      0
Indicator Code      0
2021                6
2011               13
2000              248
2003              266
2002              266
2001              266
dtype: int64
Our Choice: 2021#
Wow. 2021 has data for diabetes prevalence on almost every country and group, but then there’s almost no data for any other year.
Looks like we’ll use 2021.
year = 2021
Pivot#
With our year chosen, we can pivot this table. This gives a dataset that contains:
Only data for our chosen year.
One row for each country.
One column for each country.
This makes it easy to show data for any indicator we like.
# Prepare pivoted dataframe with countries only.
df = wdi_remove_groups(data)
df = wdi_pivot(df, year=year,index_column='Country Name', pivot_column='Indicator Name')

# Also prepare a separate dataframe with all data, for select charts.
df_all = wdi_pivot(data, year=year,index_column='Country Name', pivot_column='Indicator Name')

display(df)
| Indicator Name | Account ownership at a financial institution or with a mobile-money-service provider (% of population ages 15+) | Account ownership at a financial institution or with a mobile-money-service provider, female (% of population ages 15+) | Account ownership at a financial institution or with a mobile-money-service provider, male (% of population ages 15+) | Account ownership at a financial institution or with a mobile-money-service provider, older adults (% of population ages 25+) | Account ownership at a financial institution or with a mobile-money-service provider, poorest 40% (% of population ages 15+) | Account ownership at a financial institution or with a mobile-money-service provider, primary education or less (% of population ages 15+) | Account ownership at a financial institution or with a mobile-money-service provider, richest 60% (% of population ages 15+) | Account ownership at a financial institution or with a mobile-money-service provider, secondary education or more (% of population ages 15+) | Account ownership at a financial institution or with a mobile-money-service provider, young adults (% of population ages 15-24) | Adolescents out of school (% of lower secondary school age) | ... | Unemployment, youth female (% of female labor force ages 15-24) (national estimate) | Unemployment, youth male (% of male labor force ages 15-24) (modeled ILO estimate) | Unemployment, youth male (% of male labor force ages 15-24) (national estimate) | Unemployment, youth total (% of total labor force ages 15-24) (modeled ILO estimate) | Unemployment, youth total (% of total labor force ages 15-24) (national estimate) | Urban population | Urban population (% of total population) | Urban population growth (annual %) | Wholesale price index (2010 = 100) | Women Business and the Law Index Score (scale 1-100) |
|---|---|---|---|---|---|---|---|---|---|---|---|---|---|---|---|---|---|---|---|---|---|
| Country Name | |||||||||||||||||||||
| Afghanistan | 9.65 | 4.70 | 14.79 | 10.81 | 5.86 | 5.18 | 12.18 | 23.40 | 7.55 | 0.0 | ... | 9.410000 | 18.599001 | 8.45 | 20.226000 | 8.710000 | 10482295 | 26.314 | 3.403925 | 0.0 | 38.125 |
| Albania | 44.17 | 45.69 | 42.59 | 44.40 | 27.27 | 34.36 | 55.41 | 56.50 | 43.87 | 0.0 | ... | 0.000000 | 27.978001 | 0.00 | 27.837999 | 0.000000 | 1770478 | 62.969 | 0.443404 | 0.0 | 91.250 |
| Algeria | 44.10 | 31.19 | 56.83 | 51.28 | 31.91 | 38.99 | 52.17 | 46.23 | 26.72 | 0.0 | ... | 0.000000 | 27.827000 | 0.00 | 31.882999 | 0.000000 | 33132753 | 74.261 | 2.444352 | 0.0 | 57.500 |
| American Samoa | 0.00 | 0.00 | 0.00 | 0.00 | 0.00 | 0.00 | 0.00 | 0.00 | 0.00 | 0.0 | ... | 0.000000 | 0.000000 | 0.00 | 0.000000 | 0.000000 | 48033 | 87.169 | -0.151863 | 0.0 | 0.000 |
| Andorra | 0.00 | 0.00 | 0.00 | 0.00 | 0.00 | 0.00 | 0.00 | 0.00 | 0.00 | 0.0 | ... | 0.000000 | 0.000000 | 0.00 | 0.000000 | 0.000000 | 67962 | 87.858 | 0.050040 | 0.0 | 0.000 |
| ... | ... | ... | ... | ... | ... | ... | ... | ... | ... | ... | ... | ... | ... | ... | ... | ... | ... | ... | ... | ... | ... |
| Virgin Islands (U.S.) | 0.00 | 0.00 | 0.00 | 0.00 | 0.00 | 0.00 | 0.00 | 0.00 | 0.00 | 0.0 | ... | 0.000000 | 24.105000 | 0.00 | 27.021999 | 0.000000 | 101678 | 96.040 | -0.290692 | 0.0 | 0.000 |
| West Bank and Gaza | 33.64 | 25.93 | 41.44 | 42.39 | 17.44 | 30.50 | 44.40 | 34.56 | 18.29 | 0.0 | ... | 64.540001 | 33.717999 | 37.25 | 39.620998 | 41.669998 | 3790664 | 77.003 | 2.826525 | 0.0 | 26.250 |
| Yemen, Rep. | 0.00 | 0.00 | 0.00 | 0.00 | 0.00 | 0.00 | 0.00 | 0.00 | 0.00 | 0.0 | ... | 0.000000 | 24.332001 | 0.00 | 25.468000 | 0.000000 | 11752922 | 38.546 | 3.873048 | 0.0 | 26.875 |
| Zambia | 48.52 | 44.98 | 52.48 | 51.11 | 32.91 | 33.02 | 58.91 | 67.18 | 44.51 | 0.0 | ... | 0.000000 | 26.705000 | 0.00 | 26.054001 | 0.000000 | 8550623 | 45.192 | 4.131210 | 0.0 | 81.250 |
| Zimbabwe | 59.75 | 53.98 | 65.86 | 64.68 | 46.92 | 47.46 | 68.28 | 67.67 | 49.58 | 0.0 | ... | 0.000000 | 6.243000 | 0.00 | 7.325000 | 0.000000 | 4875224 | 32.303 | 1.719628 | 0.0 | 86.875 |
217 rows × 520 columns
Note
Those indicator names are a bit unwieldy, aren’t they? You might prefer to work with the Indicator Code column, as I do in “Do Countries Have Synthetic Traits?”.
But for this project, it would add a tedious extra step to keep looking up the code for each indicator name.
Here’s a sample of diabetes prevalence percentages for 2021, with one row per country.
df[ind_diabetes]
Country Name
Afghanistan              10.9
Albania                  10.2
Algeria                   7.1
American Samoa           20.3
Andorra                   9.7
                         ...
Virgin Islands (U.S.)    12.4
West Bank and Gaza        9.2
Yemen, Rep.               5.4
Zambia                   11.9
Zimbabwe                  2.1
Name: Diabetes prevalence (% of population ages 20 to 79), Length: 217, dtype: float64
Full Indicator List#
To see all available indicators, click to expand the cell below.
list(df.columns)
['Account ownership at a financial institution or with a mobile-money-service provider (% of population ages 15+)',
 'Account ownership at a financial institution or with a mobile-money-service provider, female (% of population ages 15+)',
 'Account ownership at a financial institution or with a mobile-money-service provider, male (% of population ages 15+)',
 'Account ownership at a financial institution or with a mobile-money-service provider, older adults (% of population ages 25+)',
 'Account ownership at a financial institution or with a mobile-money-service provider, poorest 40% (% of population ages 15+)',
 'Account ownership at a financial institution or with a mobile-money-service provider, primary education or less (% of population ages 15+)',
 'Account ownership at a financial institution or with a mobile-money-service provider, richest 60% (% of population ages 15+)',
 'Account ownership at a financial institution or with a mobile-money-service provider, secondary education or more (% of population ages 15+)',
 'Account ownership at a financial institution or with a mobile-money-service provider, young adults (% of population ages 15-24)',
 'Adolescents out of school (% of lower secondary school age)',
 'Adolescents out of school, female (% of female lower secondary school age)',
 'Adolescents out of school, male (% of male lower secondary school age)',
 'Age dependency ratio (% of working-age population)',
 'Age dependency ratio, old (% of working-age population)',
 'Age dependency ratio, young (% of working-age population)',
 'Agricultural raw materials exports (% of merchandise exports)',
 'Agricultural raw materials imports (% of merchandise imports)',
 'Agriculture, forestry, and fishing, value added (% of GDP)',
 'Agriculture, forestry, and fishing, value added (annual % growth)',
 'Agriculture, forestry, and fishing, value added (constant 2015 US$)',
 'Agriculture, forestry, and fishing, value added (constant LCU)',
 'Agriculture, forestry, and fishing, value added (current LCU)',
 'Agriculture, forestry, and fishing, value added (current US$)',
 'Bank capital to assets ratio (%)',
 'Bank liquid reserves to bank assets ratio (%)',
 'Bank nonperforming loans to total gross loans (%)',
 'Changes in inventories (constant LCU)',
 'Changes in inventories (current LCU)',
 'Changes in inventories (current US$)',
 'Charges for the use of intellectual property, payments (BoP, current US$)',
 'Charges for the use of intellectual property, receipts (BoP, current US$)',
 'Children out of school (% of primary school age)',
 'Children out of school, female (% of female primary school age)',
 'Children out of school, male (% of male primary school age)',
 'Children out of school, primary',
 'Children out of school, primary, female',
 'Children out of school, primary, male',
 'Commercial service exports (current US$)',
 'Commercial service imports (current US$)',
 'Communications, computer, etc. (% of service exports, BoP)',
 'Communications, computer, etc. (% of service imports, BoP)',
 'Completeness of birth registration (%)',
 'Completeness of birth registration, female (%)',
 'Completeness of birth registration, male (%)',
 'Completeness of birth registration, rural (%)',
 'Completeness of birth registration, urban (%)',
 'Compulsory education, duration (years)',
 'Computer, communications and other services (% of commercial service exports)',
 'Computer, communications and other services (% of commercial service imports)',
 'Consumer price index (2010 = 100)',
 'Current account balance (% of GDP)',
 'Current account balance (BoP, current US$)',
 'DEC alternative conversion factor (LCU per US$)',
 'Deposit interest rate (%)',
 'Diabetes prevalence (% of population ages 20 to 79)',
 'Discrepancy in expenditure estimate of GDP (constant LCU)',
 'Discrepancy in expenditure estimate of GDP (current LCU)',
 "Educational attainment, at least Bachelor's or equivalent, population 25+, female (%) (cumulative)",
 "Educational attainment, at least Bachelor's or equivalent, population 25+, male (%) (cumulative)",
 "Educational attainment, at least Bachelor's or equivalent, population 25+, total (%) (cumulative)",
 "Educational attainment, at least Master's or equivalent, population 25+, female (%) (cumulative)",
 "Educational attainment, at least Master's or equivalent, population 25+, male (%) (cumulative)",
 "Educational attainment, at least Master's or equivalent, population 25+, total (%) (cumulative)",
 'Educational attainment, at least completed lower secondary, population 25+, female (%) (cumulative)',
 'Educational attainment, at least completed lower secondary, population 25+, male (%) (cumulative)',
 'Educational attainment, at least completed lower secondary, population 25+, total (%) (cumulative)',
 'Educational attainment, at least completed post-secondary, population 25+, female (%) (cumulative)',
 'Educational attainment, at least completed post-secondary, population 25+, male (%) (cumulative)',
 'Educational attainment, at least completed post-secondary, population 25+, total (%) (cumulative)',
 'Educational attainment, at least completed primary, population 25+ years, female (%) (cumulative)',
 'Educational attainment, at least completed primary, population 25+ years, male (%) (cumulative)',
 'Educational attainment, at least completed primary, population 25+ years, total (%) (cumulative)',
 'Educational attainment, at least completed short-cycle tertiary, population 25+, female (%) (cumulative)',
 'Educational attainment, at least completed short-cycle tertiary, population 25+, male (%) (cumulative)',
 'Educational attainment, at least completed short-cycle tertiary, population 25+, total (%) (cumulative)',
 'Educational attainment, at least completed upper secondary, population 25+, female (%) (cumulative)',
 'Educational attainment, at least completed upper secondary, population 25+, male (%) (cumulative)',
 'Educational attainment, at least completed upper secondary, population 25+, total (%) (cumulative)',
 'Employment to population ratio, 15+, female (%) (modeled ILO estimate)',
 'Employment to population ratio, 15+, female (%) (national estimate)',
 'Employment to population ratio, 15+, male (%) (modeled ILO estimate)',
 'Employment to population ratio, 15+, male (%) (national estimate)',
 'Employment to population ratio, 15+, total (%) (modeled ILO estimate)',
 'Employment to population ratio, 15+, total (%) (national estimate)',
 'Employment to population ratio, ages 15-24, female (%) (modeled ILO estimate)',
 'Employment to population ratio, ages 15-24, female (%) (national estimate)',
 'Employment to population ratio, ages 15-24, male (%) (modeled ILO estimate)',
 'Employment to population ratio, ages 15-24, male (%) (national estimate)',
 'Employment to population ratio, ages 15-24, total (%) (modeled ILO estimate)',
 'Employment to population ratio, ages 15-24, total (%) (national estimate)',
 'Exports as a capacity to import (constant LCU)',
 'Exports of goods and services (% of GDP)',
 'Exports of goods and services (BoP, current US$)',
 'Exports of goods and services (annual % growth)',
 'Exports of goods and services (constant 2015 US$)',
 'Exports of goods and services (constant LCU)',
 'Exports of goods and services (current LCU)',
 'Exports of goods and services (current US$)',
 'Exports of goods, services and primary income (BoP, current US$)',
 'External balance on goods and services (% of GDP)',
 'External balance on goods and services (constant LCU)',
 'External balance on goods and services (current LCU)',
 'External balance on goods and services (current US$)',
 'Female share of employment in senior and middle management (%)',
 'Final consumption expenditure (% of GDP)',
 'Final consumption expenditure (annual % growth)',
 'Final consumption expenditure (constant 2015 US$)',
 'Final consumption expenditure (constant LCU)',
 'Final consumption expenditure (current LCU)',
 'Final consumption expenditure (current US$)',
 'Financial intermediary services indirectly Measured (FISIM) (constant LCU)',
 'Financial intermediary services indirectly Measured (FISIM) (current LCU)',
 'Food exports (% of merchandise exports)',
 'Food imports (% of merchandise imports)',
 'Foreign direct investment, net (BoP, current US$)',
 'Fuel exports (% of merchandise exports)',
 'Fuel imports (% of merchandise imports)',
 'GDP (constant 2015 US$)',
 'GDP (constant LCU)',
 'GDP (current LCU)',
 'GDP (current US$)',
 'GDP deflator (base year varies by country)',
 'GDP deflator: linked series (base year varies by country)',
 'GDP growth (annual %)',
 'GDP per capita (constant 2015 US$)',
 'GDP per capita (constant LCU)',
 'GDP per capita (current LCU)',
 'GDP per capita (current US$)',
 'GDP per capita growth (annual %)',
 'GDP per capita, PPP (constant 2017 international $)',
 'GDP per capita, PPP (current international $)',
 'GDP per person employed (constant 2017 PPP $)',
 'GDP, PPP (constant 2017 international $)',
 'GDP, PPP (current international $)',
 'GDP: linked series (current LCU)',
 'GNI (constant 2015 US$)',
 'GNI (constant LCU)',
 'GNI (current LCU)',
 'GNI (current US$)',
 'GNI growth (annual %)',
 'GNI per capita (constant 2015 US$)',
 'GNI per capita (constant LCU)',
 'GNI per capita (current LCU)',
 'GNI per capita growth (annual %)',
 'GNI per capita, Atlas method (current US$)',
 'GNI per capita, PPP (constant 2017 international $)',
 'GNI per capita, PPP (current international $)',
 'GNI, Atlas method (current US$)',
 'GNI, PPP (constant 2017 international $)',
 'GNI, PPP (current international $)',
 'GNI: linked series (current LCU)',
 'General government final consumption expenditure (% of GDP)',
 'General government final consumption expenditure (annual % growth)',
 'General government final consumption expenditure (constant 2015 US$)',
 'General government final consumption expenditure (constant LCU)',
 'General government final consumption expenditure (current LCU)',
 'General government final consumption expenditure (current US$)',
 'Gini index',
 'Goods exports (BoP, current US$)',
 'Goods imports (BoP, current US$)',
 'Government expenditure on education, total (% of GDP)',
 'Government expenditure on education, total (% of government expenditure)',
 'Gross capital formation (% of GDP)',
 'Gross capital formation (annual % growth)',
 'Gross capital formation (constant 2015 US$)',
 'Gross capital formation (constant LCU)',
 'Gross capital formation (current LCU)',
 'Gross capital formation (current US$)',
 'Gross domestic income (constant LCU)',
 'Gross domestic savings (% of GDP)',
 'Gross domestic savings (current LCU)',
 'Gross domestic savings (current US$)',
 'Gross fixed capital formation (% of GDP)',
 'Gross fixed capital formation (annual % growth)',
 'Gross fixed capital formation (constant 2015 US$)',
 'Gross fixed capital formation (constant LCU)',
 'Gross fixed capital formation (current LCU)',
 'Gross fixed capital formation (current US$)',
 'Gross fixed capital formation, private sector (% of GDP)',
 'Gross fixed capital formation, private sector (current LCU)',
 'Gross national expenditure (% of GDP)',
 'Gross national expenditure (constant 2015 US$)',
 'Gross national expenditure (constant LCU)',
 'Gross national expenditure (current LCU)',
 'Gross national expenditure (current US$)',
 'Gross national expenditure deflator (base year varies by country)',
 'Gross savings (% of GDP)',
 'Gross savings (% of GNI)',
 'Gross savings (current LCU)',
 'Gross savings (current US$)',
 'Gross value added at basic prices (GVA) (constant 2015 US$)',
 'Gross value added at basic prices (GVA) (constant LCU)',
 'Gross value added at basic prices (GVA) (current LCU)',
 'Gross value added at basic prices (GVA) (current US$)',
 'Households and NPISHs Final consumption expenditure (annual % growth)',
 'Households and NPISHs Final consumption expenditure (constant 2015 US$)',
 'Households and NPISHs Final consumption expenditure (constant LCU)',
 'Households and NPISHs Final consumption expenditure (current LCU)',
 'Households and NPISHs Final consumption expenditure (current US$)',
 'Households and NPISHs Final consumption expenditure per capita (constant 2015 US$)',
 'Households and NPISHs Final consumption expenditure, PPP (constant 2017 international $)',
 'Households and NPISHs Final consumption expenditure, PPP (current international $)',
 'Households and NPISHs final consumption expenditure (% of GDP)',
 'Households and NPISHs final consumption expenditure: linked series (current LCU)',
 'ICT service exports (% of service exports, BoP)',
 'ICT service exports (BoP, current US$)',
 'Imports of goods and services (% of GDP)',
 'Imports of goods and services (BoP, current US$)',
 'Imports of goods and services (annual % growth)',
 'Imports of goods and services (constant 2015 US$)',
 'Imports of goods and services (constant LCU)',
 'Imports of goods and services (current LCU)',
 'Imports of goods and services (current US$)',
 'Imports of goods, services and primary income (BoP, current US$)',
 'Income share held by fourth 20%',
 'Income share held by highest 10%',
 'Income share held by highest 20%',
 'Income share held by lowest 10%',
 'Income share held by lowest 20%',
 'Income share held by second 20%',
 'Income share held by third 20%',
 'Industry (including construction), value added (% of GDP)',
 'Industry (including construction), value added (annual % growth)',
 'Industry (including construction), value added (constant 2015 US$)',
 'Industry (including construction), value added (constant LCU)',
 'Industry (including construction), value added (current LCU)',
 'Industry (including construction), value added (current US$)',
 'Inflation, GDP deflator (annual %)',
 'Inflation, GDP deflator: linked series (annual %)',
 'Inflation, consumer prices (annual %)',
 'Insurance and financial services (% of commercial service exports)',
 'Insurance and financial services (% of commercial service imports)',
 'Insurance and financial services (% of service exports, BoP)',
 'Insurance and financial services (% of service imports, BoP)',
 'Interest rate spread (lending rate minus deposit rate, %)',
 'Internally displaced persons, new displacement associated with conflict and violence (number of cases)',
 'Internally displaced persons, new displacement associated with disasters (number of cases)',
 'Internally displaced persons, total displaced by conflict and violence (number of people)',
 'Investment in energy with private participation (current US$)',
 'Investment in transport with private participation (current US$)',
 'Investment in water and sanitation with private participation (current US$)',
 'Labor force participation rate for ages 15-24, female (%) (modeled ILO estimate)',
 'Labor force participation rate for ages 15-24, female (%) (national estimate)',
 'Labor force participation rate for ages 15-24, male (%) (modeled ILO estimate)',
 'Labor force participation rate for ages 15-24, male (%) (national estimate)',
 'Labor force participation rate for ages 15-24, total (%) (modeled ILO estimate)',
 'Labor force participation rate for ages 15-24, total (%) (national estimate)',
 'Labor force participation rate, female (% of female population ages 15+) (modeled ILO estimate)',
 'Labor force participation rate, female (% of female population ages 15+) (national estimate)',
 'Labor force participation rate, male (% of male population ages 15+) (modeled ILO estimate)',
 'Labor force participation rate, male (% of male population ages 15+) (national estimate)',
 'Labor force participation rate, total (% of total population ages 15+) (modeled ILO estimate)',
 'Labor force participation rate, total (% of total population ages 15+) (national estimate)',
 'Labor force with advanced education (% of total working-age population with advanced education)',
 'Labor force with advanced education, female (% of female working-age population with advanced education)',
 'Labor force with advanced education, male (% of male working-age population with advanced education)',
 'Labor force with basic education (% of total working-age population with basic education)',
 'Labor force with basic education, female (% of female working-age population with basic education)',
 'Labor force with basic education, male (% of male working-age population with basic education)',
 'Labor force with intermediate education (% of total working-age population with intermediate education)',
 'Labor force with intermediate education, female (% of female working-age population with intermediate education)',
 'Labor force with intermediate education, male (% of male working-age population with intermediate education)',
 'Labor force, female (% of total labor force)',
 'Labor force, total',
 'Land area (sq. km)',
 'Lending interest rate (%)',
 'Literacy rate, adult female (% of females ages 15 and above)',
 'Literacy rate, adult male (% of males ages 15 and above)',
 'Literacy rate, adult total (% of people ages 15 and above)',
 'Literacy rate, youth (ages 15-24), gender parity index (GPI)',
 'Literacy rate, youth female (% of females ages 15-24)',
 'Literacy rate, youth male (% of males ages 15-24)',
 'Literacy rate, youth total (% of people ages 15-24)',
 'Lower secondary completion rate, female (% of relevant age group)',
 'Lower secondary completion rate, male (% of relevant age group)',
 'Lower secondary completion rate, total (% of relevant age group)',
 'Lower secondary school starting age (years)',
 'Manufactures exports (% of merchandise exports)',
 'Manufactures imports (% of merchandise imports)',
 'Manufacturing, value added (% of GDP)',
 'Manufacturing, value added (annual % growth)',
 'Manufacturing, value added (constant 2015 US$)',
 'Manufacturing, value added (constant LCU)',
 'Manufacturing, value added (current LCU)',
 'Manufacturing, value added (current US$)',
 'Marine protected areas (% of territorial waters)',
 'Merchandise exports (current US$)',
 'Merchandise imports (current US$)',
 'Merchandise trade (% of GDP)',
 'Net capital account (BoP, current US$)',
 'Net errors and omissions (BoP, current US$)',
 'Net financial account (BoP, current US$)',
 'Net primary income (BoP, current US$)',
 'Net primary income (Net income from abroad) (constant LCU)',
 'Net primary income (Net income from abroad) (current LCU)',
 'Net primary income (Net income from abroad) (current US$)',
 'Net secondary income (BoP, current US$)',
 'Net secondary income (Net current transfers from abroad) (current LCU)',
 'Net secondary income (Net current transfers from abroad) (current US$)',
 'Net trade in goods (BoP, current US$)',
 'Net trade in goods and services (BoP, current US$)',
 'Official exchange rate (LCU per US$, period average)',
 'Ores and metals exports (% of merchandise exports)',
 'Ores and metals imports (% of merchandise imports)',
 'PPP conversion factor, GDP (LCU per international $)',
 'PPP conversion factor, private consumption (LCU per international $)',
 'Part time employment, female (% of total female employment)',
 'Part time employment, male (% of total male employment)',
 'Part time employment, total (% of total employment)',
 'Personal transfers, receipts (BoP, current US$)',
 'Population ages 0-14 (% of total population)',
 'Population ages 0-14, female',
 'Population ages 0-14, female (% of female population)',
 'Population ages 0-14, male',
 'Population ages 0-14, male (% of male population)',
 'Population ages 0-14, total',
 'Population ages 00-04, female (% of female population)',
 'Population ages 00-04, male (% of male population)',
 'Population ages 05-09, female (% of female population)',
 'Population ages 05-09, male (% of male population)',
 'Population ages 10-14, female (% of female population)',
 'Population ages 10-14, male (% of male population)',
 'Population ages 15-19, female (% of female population)',
 'Population ages 15-19, male (% of male population)',
 'Population ages 15-64 (% of total population)',
 'Population ages 15-64, female',
 'Population ages 15-64, female (% of female population)',
 'Population ages 15-64, male',
 'Population ages 15-64, male (% of male population)',
 'Population ages 15-64, total',
 'Population ages 20-24, female (% of female population)',
 'Population ages 20-24, male (% of male population)',
 'Population ages 25-29, female (% of female population)',
 'Population ages 25-29, male (% of male population)',
 'Population ages 30-34, female (% of female population)',
 'Population ages 30-34, male (% of male population)',
 'Population ages 35-39, female (% of female population)',
 'Population ages 35-39, male (% of male population)',
 'Population ages 40-44, female (% of female population)',
 'Population ages 40-44, male (% of male population)',
 'Population ages 45-49, female (% of female population)',
 'Population ages 45-49, male (% of male population)',
 'Population ages 50-54, female (% of female population)',
 'Population ages 50-54, male (% of male population)',
 'Population ages 55-59, female (% of female population)',
 'Population ages 55-59, male (% of male population)',
 'Population ages 60-64, female (% of female population)',
 'Population ages 60-64, male (% of male population)',
 'Population ages 65 and above (% of total population)',
 'Population ages 65 and above, female',
 'Population ages 65 and above, female (% of female population)',
 'Population ages 65 and above, male',
 'Population ages 65 and above, male (% of male population)',
 'Population ages 65 and above, total',
 'Population ages 65-69, female (% of female population)',
 'Population ages 65-69, male (% of male population)',
 'Population ages 70-74, female (% of female population)',
 'Population ages 70-74, male (% of male population)',
 'Population ages 75-79, female (% of female population)',
 'Population ages 75-79, male (% of male population)',
 'Population ages 80 and above, female (% of female population)',
 'Population ages 80 and above, male (% of male population)',
 'Population density (people per sq. km of land area)',
 'Population growth (annual %)',
 'Population in largest city',
 'Population in the largest city (% of urban population)',
 'Population in urban agglomerations of more than 1 million',
 'Population in urban agglomerations of more than 1 million (% of total population)',
 'Population, female',
 'Population, female (% of total population)',
 'Population, male',
 'Population, male (% of total population)',
 'Population, total',
 'Portfolio investment, net (BoP, current US$)',
 'Poverty gap at $1.90 a day (2011 PPP) (%)',
 'Poverty gap at $3.20 a day (2011 PPP) (%)',
 'Poverty gap at $5.50 a day (2011 PPP) (%)',
 'Poverty headcount ratio at $1.90 a day (2011 PPP) (% of population)',
 'Poverty headcount ratio at $3.20 a day (2011 PPP) (% of population)',
 'Poverty headcount ratio at $5.50 a day (2011 PPP) (% of population)',
 'Preprimary education, duration (years)',
 'Prevalence of overweight, weight for height (% of children under 5)',
 'Prevalence of overweight, weight for height, female (% of children under 5)',
 'Prevalence of overweight, weight for height, male (% of children under 5)',
 'Prevalence of severe wasting, weight for height (% of children under 5)',
 'Prevalence of severe wasting, weight for height, female (% of children under 5)',
 'Prevalence of severe wasting, weight for height, male (% of children under 5)',
 'Prevalence of stunting, height for age (% of children under 5)',
 'Prevalence of stunting, height for age, female (% of children under 5)',
 'Prevalence of stunting, height for age, male (% of children under 5)',
 'Prevalence of underweight, weight for age (% of children under 5)',
 'Prevalence of underweight, weight for age, female (% of children under 5)',
 'Prevalence of underweight, weight for age, male (% of children under 5)',
 'Prevalence of wasting, weight for height (% of children under 5)',
 'Prevalence of wasting, weight for height, female (% of children under 5)',
 'Prevalence of wasting, weight for height, male (% of children under 5)',
 'Price level ratio of PPP conversion factor (GDP) to market exchange rate',
 'Primary completion rate, female (% of relevant age group)',
 'Primary completion rate, male (% of relevant age group)',
 'Primary completion rate, total (% of relevant age group)',
 'Primary education, duration (years)',
 'Primary education, pupils',
 'Primary education, teachers',
 'Primary education, teachers (% female)',
 'Primary government expenditures as a proportion of original approved budget (%)',
 'Primary income payments (BoP, current US$)',
 'Primary income receipts (BoP, current US$)',
 'Primary school starting age (years)',
 'Proportion of seats held by women in national parliaments (%)',
 'Public private partnerships investment in energy (current US$)',
 'Public private partnerships investment in transport (current US$)',
 'Public private partnerships investment in water and sanitation (current US$)',
 'Ratio of female to male labor force participation rate (%) (modeled ILO estimate)',
 'Ratio of female to male labor force participation rate (%) (national estimate)',
 'Real effective exchange rate index (2010 = 100)',
 'Real interest rate (%)',
 'Refugee population by country or territory of asylum',
 'Refugee population by country or territory of origin',
 'Research and development expenditure (% of GDP)',
 'Researchers in R&D (per million people)',
 'Reserves and related items (BoP, current US$)',
 'Risk premium on lending (lending rate minus treasury bill rate, %)',
 'Rural population',
 'Rural population (% of total population)',
 'Rural population growth (annual %)',
 'S&P Global Equity Indices (annual % change)',
 'School enrollment, preprimary (% gross)',
 'School enrollment, preprimary, female (% gross)',
 'School enrollment, preprimary, male (% gross)',
 'School enrollment, primary (% gross)',
 'School enrollment, primary (gross), gender parity index (GPI)',
 'School enrollment, primary and secondary (gross), gender parity index (GPI)',
 'School enrollment, primary, female (% gross)',
 'School enrollment, primary, male (% gross)',
 'School enrollment, primary, private (% of total primary)',
 'School enrollment, secondary (% gross)',
 'School enrollment, secondary (gross), gender parity index (GPI)',
 'School enrollment, secondary, female (% gross)',
 'School enrollment, secondary, male (% gross)',
 'School enrollment, secondary, private (% of total secondary)',
 'School enrollment, tertiary (% gross)',
 'School enrollment, tertiary (gross), gender parity index (GPI)',
 'School enrollment, tertiary, female (% gross)',
 'School enrollment, tertiary, male (% gross)',
 'Secondary education, duration (years)',
 'Secondary education, pupils',
 'Secondary education, teachers',
 'Secondary education, teachers (% female)',
 'Secondary education, teachers, female',
 'Secondary income receipts (BoP, current US$)',
 'Secondary income, other sectors, payments (BoP, current US$)',
 'Service exports (BoP, current US$)',
 'Service imports (BoP, current US$)',
 'Services, value added (% of GDP)',
 'Services, value added (annual % growth)',
 'Services, value added (constant 2015 US$)',
 'Services, value added (constant LCU)',
 'Services, value added (current LCU)',
 'Services, value added (current US$)',
 'Share of youth not in education, employment or training, female (% of female youth population)',
 'Share of youth not in education, employment or training, male (% of male youth population)',
 'Share of youth not in education, employment or training, total (% of youth population)',
 'Taxes less subsidies on products (constant LCU)',
 'Taxes less subsidies on products (current LCU)',
 'Taxes less subsidies on products (current US$)',
 'Terms of trade adjustment (constant LCU)',
 'Terrestrial and marine protected areas (% of total territorial area)',
 'Terrestrial protected areas (% of total land area)',
 'Tertiary education, academic staff (% female)',
 'Total reserves (includes gold, current US$)',
 'Total reserves in months of imports',
 'Total reserves minus gold (current US$)',
 'Trade (% of GDP)',
 'Trade in services (% of GDP)',
 'Trained teachers in lower secondary education (% of total teachers)',
 'Trained teachers in lower secondary education, female (% of female teachers)',
 'Trained teachers in lower secondary education, male (% of male teachers)',
 'Trained teachers in preprimary education (% of total teachers)',
 'Trained teachers in preprimary education, female (% of female teachers)',
 'Trained teachers in preprimary education, male (% of male teachers)',
 'Trained teachers in primary education (% of total teachers)',
 'Trained teachers in primary education, female (% of female teachers)',
 'Trained teachers in primary education, male (% of male teachers)',
 'Trained teachers in secondary education (% of total teachers)',
 'Trained teachers in secondary education, female (% of female teachers)',
 'Trained teachers in secondary education, male (% of male teachers)',
 'Transport services (% of commercial service exports)',
 'Transport services (% of commercial service imports)',
 'Transport services (% of service exports, BoP)',
 'Transport services (% of service imports, BoP)',
 'Travel services (% of commercial service exports)',
 'Travel services (% of commercial service imports)',
 'Travel services (% of service exports, BoP)',
 'Travel services (% of service imports, BoP)',
 'Unemployment with advanced education (% of total labor force with advanced education)',
 'Unemployment with advanced education, female (% of female labor force with advanced education)',
 'Unemployment with advanced education, male (% of male labor force with advanced education)',
 'Unemployment with basic education (% of total labor force with basic education)',
 'Unemployment with basic education, female (% of female labor force with basic education)',
 'Unemployment with basic education, male (% of male labor force with basic education)',
 'Unemployment with intermediate education (% of total labor force with intermediate education)',
 'Unemployment with intermediate education, female (% of female labor force with intermediate education)',
 'Unemployment with intermediate education, male (% of male labor force with intermediate education)',
 'Unemployment, female (% of female labor force) (modeled ILO estimate)',
 'Unemployment, female (% of female labor force) (national estimate)',
 'Unemployment, male (% of male labor force) (modeled ILO estimate)',
 'Unemployment, male (% of male labor force) (national estimate)',
 'Unemployment, total (% of total labor force) (modeled ILO estimate)',
 'Unemployment, total (% of total labor force) (national estimate)',
 'Unemployment, youth female (% of female labor force ages 15-24) (modeled ILO estimate)',
 'Unemployment, youth female (% of female labor force ages 15-24) (national estimate)',
 'Unemployment, youth male (% of male labor force ages 15-24) (modeled ILO estimate)',
 'Unemployment, youth male (% of male labor force ages 15-24) (national estimate)',
 'Unemployment, youth total (% of total labor force ages 15-24) (modeled ILO estimate)',
 'Unemployment, youth total (% of total labor force ages 15-24) (national estimate)',
 'Urban population',
 'Urban population (% of total population)',
 'Urban population growth (annual %)',
 'Wholesale price index (2010 = 100)',
 'Women Business and the Law Index Score (scale 1-100)']
Which countries have the most wealth?#
Since we are focusing on how income affects individual lifestyles, let’s look at Gross National Income (GNI), rather than the usual Gross Domestic Product (GDP).
Gross National Income (GNI)#
ind_gni='GNI (current US$)'

s(df, [ind_gni], countries="countries",\
  caption="Wealthiest countries by GNI")\
    .format({ind_gni: fmt_usd})\
    .bar(subset=[ind_gni], color=color_wealth,vmin=0)
| Indicator Name | GNI (current US$) |
|---|---|
| Country Name | |
| United States | $ 23,393,116,832,631 |
| China | $ 17,576,647,542,255 |
| Japan | $ 5,124,619,121,543 |
| Germany | $ 4,350,736,250,907 |
| United Kingdom | $ 3,170,239,375,975 |
| India | $ 3,123,966,782,597 |
| France | $ 3,002,339,248,164 |
| Italy | $ 2,125,094,565,833 |
| Canada | $ 1,975,686,764,624 |
| Korea, Rep. | $ 1,820,500,362,644 |
GNI Per Capita#
Wait, though. We want to know whether individual wealth correlates with diabetes. Instead of total income for the entire country, which countries have the most income per person?
ind_gni_per_capita='GNI per capita, Atlas method (current US$)'
max_gni_per_capita=max(df[ind_gni_per_capita])

s(df, [ind_gni_per_capita, ind_gni], countries="countries",\
     caption="Wealthiest countries by GNI per capita")\
    .format({ind_gni: fmt_usd, ind_gni_per_capita: fmt_usd})\
    .bar(subset=[ind_gni], color=color_wealth,vmin=0)\
    .bar(subset=[ind_gni_per_capita], color=color_wealth,vmin=0)
| Indicator Name | GNI per capita, Atlas method (current US$) | GNI (current US$) |
|---|---|---|
| Country Name | ||
| Bermuda | $ 116,540 | $ 7,259,199,194 |
| Switzerland | $ 90,360 | $ 797,464,598,720 |
| Norway | $ 84,090 | $ 504,617,694,994 |
| Ireland | $ 74,520 | $ 372,085,194,240 |
| United States | $ 70,430 | $ 23,393,116,832,631 |
| Denmark | $ 68,110 | $ 409,819,096,013 |
| Iceland | $ 64,410 | $ 24,697,606,585 |
| Singapore | $ 64,010 | $ 349,153,926,312 |
| Sweden | $ 58,890 | $ 646,115,186,117 |
| Qatar | $ 57,120 | $ 176,807,322,012 |
Interesting! In 2021, only the United States is in both top 10 lists. Why?
Let’s examine the GNI per capita for the “wealthiest” countries by GNI.
GNI Per Capita for the “Wealthiest” Countries#
countries_top_gni = list(df[ind_gni].sort_values(ascending=False).head(10).index)

s(df, [ind_gni, ind_gni_per_capita], countries=countries_top_gni,\
     caption="Wealthiest countries by GNI, with GNI per capita")\
    .format({ind_gni: fmt_usd, ind_gni_per_capita: fmt_usd})\
    .bar(subset=[ind_gni], color=color_wealth,vmin=0)\
    .bar(subset=[ind_gni_per_capita], color=color_wealth,vmin=0,vmax=max_gni_per_capita)
| Indicator Name | GNI (current US$) | GNI per capita, Atlas method (current US$) |
|---|---|---|
| Country Name | ||
| United States | $ 23,393,116,832,631 | $ 70,430 |
| China | $ 17,576,647,542,255 | $ 11,890 |
| Japan | $ 5,124,619,121,543 | $ 42,620 |
| Germany | $ 4,350,736,250,907 | $ 51,040 |
| United Kingdom | $ 3,170,239,375,975 | $ 45,380 |
| India | $ 3,123,966,782,597 | $ 2,170 |
| France | $ 3,002,339,248,164 | $ 43,880 |
| Italy | $ 2,125,094,565,833 | $ 35,710 |
| Canada | $ 1,975,686,764,624 | $ 48,310 |
| Korea, Rep. | $ 1,820,500,362,644 | $ 34,980 |
Hmm. We see some stark contrasts.
In 2021, although China had the second highest GNI, each person’s share was around one sixth that of a United States resident.
And India, with a GNI of over $3 trillion, roughly as much as UK and France, had a per capita income of only $2,170, compared to $45,380 and $43,880, respectively.
But even the “wealthiest” country, the United States, has a GNI per capita ($70,430) that is not quite two-thirds that of the top ranker from our previous chart, Bermuda ($116,540).
For Further Research
What is going on in Bermuda???
Focus on GNI Per Capita#
It seems that the national GNI may be highly misleading here. GNI per capita will give us a much better sense of individual wealth.
Even so, this an indicator not perfect. A country with 1 trillion in GNI and only two residents, one of whom is broke, would have a GNI per capita of half a billion dollars.
More realistically, if the bottom 90% of people is sharing only 50% of the wealth, then the average of their per capita income will be half the official average.
Ideally, we could also examine the income distribution in each population. The WDI dataset does provide indicators that could help, such as Income share held by highest 20%, Income share held by second 20%, and so on.
Unfortunately, none of those indicators had any data for this year.
For now, GNI per capita will give us a rough approximation of individual wealth.
Which Countries Have the Highest Rates of Diabetes?#
Countries With Highest Diabetes Prevalence#
ind_name=ind_diabetes
s(df, [ind_name], countries='countries',\
 caption="Countries with Highest Diabetes Prevalence")\
    .format({ind_name: fmt_percent})\
    .bar(subset=[ind_name], color=color_diabetes,vmin=0)
| Indicator Name | Diabetes prevalence (% of population ages 20 to 79) |
|---|---|
| Country Name | |
| Pakistan | 30.8% |
| French Polynesia | 25.2% |
| Kuwait | 24.9% |
| New Caledonia | 23.4% |
| Nauru | 23.4% |
| Northern Mariana Islands | 23.4% |
| Marshall Islands | 23.0% |
| Mauritius | 22.6% |
| Kiribati | 22.1% |
| Egypt, Arab Rep. | 20.9% |
Wow. The United States isn’t even in that list! Neither are any other countries with the top GNI or GNI per capita.
Let’s get the diabetes rates for countries with the highest GNI per capita.
Diabetes Prevalence for Wealthiest Countries#
countries_top_gni_per_capita = list(df[ind_gni_per_capita].sort_values(ascending=False).head(10).index)
max_diab=max(df[ind_diabetes])

s(df, [ind_gni_per_capita, ind_diabetes], countries=countries_top_gni_per_capita,\
 caption="Diabetes prevalence for wealthiest countries (GNI per capita)")\
    .bar(subset=[ind_diabetes], color=color_diabetes,vmin=0,vmax=max_diab)\
    .bar(subset=[ind_gni_per_capita], color=color_wealth,vmin=0,vmax=max_gni_per_capita)\
    .format({ind_diabetes: fmt_percent, ind_gni_per_capita: fmt_usd})\
    .set_table_styles(table_styles)
| Indicator Name | GNI per capita, Atlas method (current US$) | Diabetes prevalence (% of population ages 20 to 79) |
|---|---|---|
| Country Name | ||
| Bermuda | $ 116,540 | 13.0% |
| Switzerland | $ 90,360 | 4.6% |
| Norway | $ 84,090 | 3.6% |
| Ireland | $ 74,520 | 3.0% |
| United States | $ 70,430 | 10.7% |
| Denmark | $ 68,110 | 5.3% |
| Iceland | $ 64,410 | 5.5% |
| Singapore | $ 64,010 | 11.6% |
| Sweden | $ 58,890 | 5.0% |
| Qatar | $ 57,120 | 19.5% |
What is going on? Except for Qatar, the diabetes rates for these wealthy countries are below 15%, or even 10%.
By contrast, the countries with the highest diabetes rates are over 20%, even 30%.
Do we have this precisely backwards? Are the poorest countries more at risk of diabetes?
GNP Per Capita for Top Diabetes Prevalence#
countries_top_diabetes = list(df[ind_diabetes].sort_values(ascending=True).tail(10).index)
max_diab=max(df[ind_diabetes])

s(df, [ind_diabetes, ind_gni_per_capita], countries=countries_top_diabetes,\
 caption="Countries with highest diabetes prevalence, with GNI per capita")\
    .bar(subset=[ind_diabetes], color=color_diabetes,vmin=0,vmax=max_diab)\
    .bar(subset=[ind_gni_per_capita], color=color_wealth,vmin=0,vmax=max_gni_per_capita)\
    .format({ind_diabetes: fmt_percent, ind_gni_per_capita: fmt_usd})\
    .set_table_styles(table_styles)
| Indicator Name | Diabetes prevalence (% of population ages 20 to 79) | GNI per capita, Atlas method (current US$) |
|---|---|---|
| Country Name | ||
| Pakistan | 30.8% | $ 1,500 |
| French Polynesia | 25.2% | $ 0 |
| Kuwait | 24.9% | $ 0 |
| Nauru | 23.4% | $ 19,470 |
| Northern Mariana Islands | 23.4% | $ 0 |
| New Caledonia | 23.4% | $ 0 |
| Marshall Islands | 23.0% | $ 5,050 |
| Mauritius | 22.6% | $ 10,860 |
| Kiribati | 22.1% | $ 0 |
| Egypt, Arab Rep. | 20.9% | $ 3,510 |
Hmm. At first, it looks like these countries with the highest diabetes prevalence certainly seem on the lower end of the income scale.
Btu for several of these countries, GNI per capita equals 0.
This is impossible, so it has to be missing data.
GNP Per Capita for Top Diabetes Prevalence, Excluding Missing GNI Data#
Let’s look again at the countries with the highest diabetes prevalence, but filter out countries with missing GNI data.
df2=df[df[ind_gni_per_capita] != 0]
s(df2, [ind_diabetes, ind_gni_per_capita], countries=list(df2.index),\
 caption="Countries with highest diabetes prevalence, with GNI per capita\n(Excluding countries with missing GNI per capita data)")\
    .bar(subset=[ind_diabetes], color=color_diabetes,vmin=0,vmax=max_diab)\
    .bar(subset=[ind_gni_per_capita], color=color_wealth,vmin=0,vmax=max_gni_per_capita)\
    .format({ind_diabetes: fmt_percent, ind_gni_per_capita: fmt_usd})\
    .set_table_styles(table_styles)
| Indicator Name | Diabetes prevalence (% of population ages 20 to 79) | GNI per capita, Atlas method (current US$) |
|---|---|---|
| Country Name | ||
| Pakistan | 30.8% | $ 1,500 |
| Nauru | 23.4% | $ 19,470 |
| Marshall Islands | 23.0% | $ 5,050 |
| Mauritius | 22.6% | $ 10,860 |
| Egypt, Arab Rep. | 20.9% | $ 3,510 |
| Tuvalu | 20.3% | $ 6,760 |
| Solomon Islands | 19.8% | $ 2,300 |
| Qatar | 19.5% | $ 57,120 |
| Malaysia | 19.0% | $ 10,930 |
| Sudan | 18.9% | $ 670 |
Even after filtering out countries with missing GNI per capita, we are still looking at mostly lower income countries here.
The one exception is Qatar, which is also in our list of wealthiest countries.
Still, it’s not clear whether these are extremely low incomes, or whether there is any correlation at all. Let’s investigate further.
Diabetes by Income Bracket#
The WDI dataset includes groupings by income. Let’s do a quick sanity check and see what the diabetes rates are for High Income, Middle Income, and Low Income countries.
income_brackets=['High income', 'Middle income', 'Low income']
s(df_all, [ind_diabetes], countries=income_brackets,\
 caption="Diabetes prevalence by country income brackets")\
    .bar(subset=[ind_diabetes],color=color_diabetes,vmin=0,vmax=max_diab)\
    .format({ind_diabetes: fmt_percent})\
    .set_table_styles(table_styles)
| Indicator Name | Diabetes prevalence (% of population ages 20 to 79) |
|---|---|
| Country Name | |
| Middle income | 10.4% |
| High income | 8.4% |
| Low income | 6.8% |
Interesting. The lowest income countries still have the lowest diabetes rate, but the middle income countries actually have the highest rate.
But look again at how high the diabetes rates are for the countries with the highest rates: well over 20%. These averages aren’t anywhere near those numbers.
Income may not be useful an indicator for diabetes.
Findings: Scatterplot Charts#
So far, we’ve examined the data using tables. Now, let’s use scatterplots to see whether high and low diabetes prevalence correlate with GNI per capita.
Perhaps the visual overview will reveal patterns we’ve missed.
Remove Countries With Missing Data#
Note
For the rest of this report, we will exclude countries with missing data.
If a country does not have data for this year on either diabetes prevalence or GNI per capita, it is excluded from the remaining analysis.
# Remove missing data.
df = df[df[ind_diabetes] != 0]
df = df[df[ind_gni_per_capita] != 0]
df.shape
(171, 520)
Diabetes Prevalence and GNI per capita, All Countries#
In this scatter plot, each point shows a country’s diabetes prevalence compared with its GNI per capita.
%matplotlib inline
import matplotlib.pyplot as plt

dot_size=10

xlim=max(df[ind_gni_per_capita])
ylim=max(df[ind_diabetes])

fig, axis = plt.subplots()
plt.suptitle(f"Diabetes Prevalence and GNI Per Capita, All Countries ({year})")
plt.title("Excluding countries with missing data", color="gray", style="italic",fontsize=10)

X,Y = config_axis(axis,plt,df,xlim,ylim)
axis.scatter(X, Y,s=dot_size,c=df[ind_gni_per_capita])

# Special interest
add_country(df, plt, "United States",box='#ffeeee',c='red')
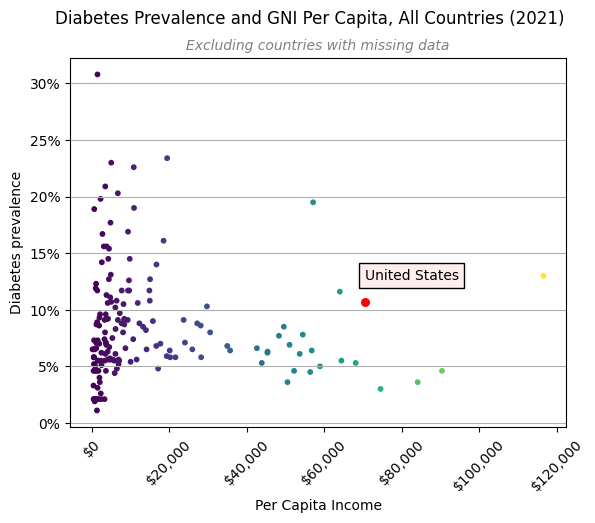
To my surprise, wealth and diabetes really do not seem to correlate.
As we move up the Y axis on the left edge, we see many lower income countries with much higher diabetes rates than the United States and other wealthy countries.
As we move right along the X axis, we also see higher income countries with some of the lowest diabetes rates.
Examine the Extremes#
But this chart has almost 200 data points. Let’s look separately at:
Countries with the highest and lowest diabetes prevalence
Countries with the highest and lowest GNI per capita
In each chart, we’ll also include some “reference” countries, like the United States.
Note
To make the country names readable, I have automatically repositioned them with adjust_text(). But this sometimes moves a label rather far from its point, so you can check the data in the ensuing tables.
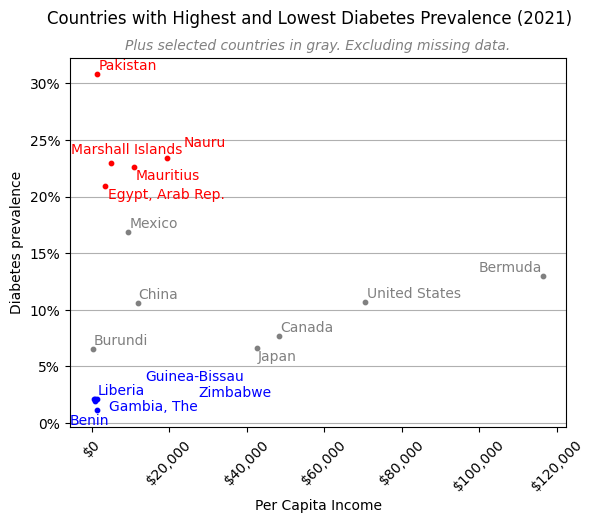
Countries with Highest and Lowest Diabetes Prevalence#
For reference, we’ll also include the countries with the highest and lowest GNI per capita: Bermuda and Burundi.
n=5
top_diab = df.sort_values([ind_diabetes])[len(df)-n:]
btm_diab = df.sort_values([ind_diabetes])[0:n]

## Ref countries
ref_countries = ['United States', 'Mexico', 'China', 'Canada', 'Japan']
## Add the richest and poorest countries for reference.
ref_countries.append(df.sort_values([ind_gni_per_capita], ascending=True).iloc[0].name)
ref_countries.append(df.sort_values([ind_gni_per_capita], ascending=False).iloc[0].name)
ref = df.loc[ref_countries]

color_top_diab='red'
color_btm_diab='blue'
color_ref='gray'

chart_subtitle="Plus selected countries in gray. Excluding missing data."


fig, axis = plt.subplots()
plt.suptitle(f"Countries with Highest and Lowest Diabetes Prevalence ({year})")
plt.title(chart_subtitle, color="gray", style="italic",fontsize=10)
# Do not set X and Y this time, but do set the labels.
config_axis(axis,plt,df,xlim,ylim)

plot_countries(axis, plt, top_diab, color_top_diab, dot_size)
plot_countries(axis, plt, btm_diab, color_btm_diab, dot_size)
plot_countries(axis, plt, ref, color_ref, dot_size)

## Use adjust_text to make (most) labels readable
## https://adjusttext.readthedocs.io/en/latest/Examples.html

adjust_text(collect_texts([top_diab,btm_diab,ref],\
                          [color_top_diab,color_btm_diab,color_ref],\
                          xf=ind_gni_per_capita,
                          yf=ind_diabetes),
            expand_text=(1, 1),
            force_text=(0.25, 0.25),
           )
df2=pd.concat([top_diab, ref, btm_diab])
df2=pd.concat([top_diab, ref, btm_diab])

s(df2,
    [ind_diabetes, ind_gni_per_capita],\
    head=20,\
    countries=list(df2.index),\
    caption=f"Top and bottom diabetes prevalence, with reference countries and GNI per capita")\
    .bar(subset=[ind_diabetes], color=color_diabetes,vmin=0,vmax=max_diab)\
    .bar(subset=[ind_gni_per_capita], color=color_wealth,vmin=0,vmax=max_gni_per_capita)\
    .format({ind_diabetes: fmt_percent, ind_gni_per_capita: fmt_usd})\
    .applymap_index(country_color, countries=list(top_diab.index), color=color_top_diab)\
    .applymap_index(country_color, countries=list(ref.index), color=color_ref)\
    .applymap_index(country_color, countries=list(btm_diab.index), color=color_btm_diab)\
    .set_table_styles(table_styles)
| Indicator Name | Diabetes prevalence (% of population ages 20 to 79) | GNI per capita, Atlas method (current US$) |
|---|---|---|
| Country Name | ||
| Pakistan | 30.8% | $ 1,500 |
| Nauru | 23.4% | $ 19,470 |
| Marshall Islands | 23.0% | $ 5,050 |
| Mauritius | 22.6% | $ 10,860 |
| Egypt, Arab Rep. | 20.9% | $ 3,510 |
| Mexico | 16.9% | $ 9,380 |
| Bermuda | 13.0% | $ 116,540 |
| United States | 10.7% | $ 70,430 |
| China | 10.6% | $ 11,890 |
| Canada | 7.7% | $ 48,310 |
| Japan | 6.6% | $ 42,620 |
| Burundi | 6.5% | $ 240 |
| Zimbabwe | 2.1% | $ 1,400 |
| Guinea-Bissau | 2.1% | $ 780 |
| Liberia | 2.1% | $ 620 |
| Gambia, The | 1.9% | $ 800 |
| Benin | 1.1% | $ 1,370 |
Here, we see that the countries with both the highest and the lowest rates of diabetes have low per capita income.
The highest per capita income here is Nauru, with less than $20,000/year, the second is Mauritius with $10,860, and then all the rest, whether the diabetes prevalance is extremely high or extremely low, have a yearly GNI per person of less than $10,000.
True, the countries with the lowest diabetes rates have extremely low income, less than $2,000 each. One wonders whether the actual prevalence is even higher, given how scarce the resources to gather such statistics may be.
On the other hand, the country with the highest diabetes rate recorded in 2021, by a wide margin, was Pakistan, with a yearly GNI of only $1,500.
It seems very clear that neither low nor high income seems to affect the risk of diabetes.
Countries with Highest and Lowest GNI Per Capita#
To be sure, let’s look at countries with the highest and lowest GNI per capita.
For reference, we’ll also include countries with the highest and lowest diabetes prevalence: Pakistan.
fig, axis = plt.subplots()
plt.suptitle(f"Countries with Highest and Lowest GNI per capita ({year})")
plt.title(chart_subtitle, color="gray", style="italic",fontsize=10)

top_gni = df.sort_values([ind_gni_per_capita])[len(df)-n:]
btm_gni = df.sort_values([ind_gni_per_capita])[0:n]

## Ref countries
ref_countries = ['Mexico', 'China', 'Canada', 'Japan']
## Add the countries with highest and lowest rates of diabetes.
ref_countries.append(df.sort_values([ind_diabetes], ascending=True).iloc[0].name)
ref_countries.append(df.sort_values([ind_diabetes], ascending=False).iloc[0].name)

ref = df.loc[ref_countries]

color_top_gni='green'
color_btm_gni='purple'


# Do not set X and Y this time, but do set the labels.
config_axis(axis,plt,df,xlim,ylim)

plot_countries(axis, plt, top_gni, color_top_gni, dot_size)
plot_countries(axis, plt, btm_gni, color_btm_gni, dot_size)
plot_countries(axis, plt, ref, color_ref, dot_size)

adjust_text(collect_texts([top_gni,btm_gni,ref],\
                          [color_top_gni,color_btm_gni,color_ref],\
                          xf=ind_gni_per_capita,
                          yf=ind_diabetes),
            expand_text=(1, 1),
            force_text=(0.25, 0.25),
           )
df2=pd.concat([top_gni, ref, btm_gni])
s(df2,
    [ind_gni_per_capita, ind_diabetes],\
    head=20,\
    countries=list(df2.index),\
    caption=f"Top and bottom diabetes prevalence, with reference countries and GNI per capita")\
    .bar(subset=[ind_diabetes], color=color_diabetes,vmin=0,vmax=max_diab)\
    .bar(subset=[ind_gni_per_capita], color=color_wealth,vmin=0,vmax=max_gni_per_capita)\
    .format({ind_diabetes: fmt_percent, ind_gni_per_capita: fmt_usd})\
    .applymap_index(country_color, countries=list(top_gni.index), color=color_top_gni)\
    .applymap_index(country_color, countries=list(ref.index), color=color_ref)\
    .applymap_index(country_color, countries=list(btm_gni.index), color=color_btm_gni)\
    .set_table_styles(table_styles)
| Indicator Name | GNI per capita, Atlas method (current US$) | Diabetes prevalence (% of population ages 20 to 79) |
|---|---|---|
| Country Name | ||
| Bermuda | $ 116,540 | 13.0% |
| Switzerland | $ 90,360 | 4.6% |
| Norway | $ 84,090 | 3.6% |
| Ireland | $ 74,520 | 3.0% |
| United States | $ 70,430 | 10.7% |
| Canada | $ 48,310 | 7.7% |
| Japan | $ 42,620 | 6.6% |
| China | $ 11,890 | 10.6% |
| Mexico | $ 9,380 | 16.9% |
| Pakistan | $ 1,500 | 30.8% |
| Benin | $ 1,370 | 1.1% |
| Sierra Leone | $ 510 | 2.1% |
| Madagascar | $ 500 | 4.6% |
| Mozambique | $ 480 | 3.3% |
| Somalia | $ 450 | 6.5% |
| Burundi | $ 240 | 6.5% |
Once again, we see no obvious correlation.
All the lowest income countries have diabetes rates lower than 7%, but so do three of the five highest income countries, Switzerland, Norway, and Ireland. While Bermuda and the United States have higher rates of 13% and 10.7%, they are nowhere near Pakistan’s 30.8%.
We conclude that per capita income simply does not seem to correlate with diabetes.
Conclusion#
Whether we focus on diabetes prevalence or per capita income, there doesn’t seem to be any correlation between the two.
We find high diabetes rates in both poor and rich countries, and low diabetes rates as well.
Whatever societal factors increase the risk of diabetes, wealth does not seem to show an obvious correlation.
Acknowledgments#
This data was sourced from the World Bank.
The project is my own work.
- 1
Source: CDC, “What is Diabetes?” Accessed 2022 Sep 15.